Sending Python Spans to Jaeger via a Collector
In the third episode of the series, the spans are sent from Python to Jaeger via an OpenTelemetry collector.
This is the text version for those who prefer to read instead. If you got here and want to watch, just click the image below.
Building the System: A Place to Send Spans
For this demo the spans will be send to the CNCF project Jaeger, but it could just as easily be any other open source or commercial backend.
Use Docker (or Podman) to start the Jaeger allInOne demo image and expose two ports:
- 18868 (for the user interface)
- 4317 (so the built in Jaeger collector can receive ports via gRPC on the standard gRPC port)
docker run --rm --name jaeger \
  -p 16686:16686 \
  -p 4317:4317 \
  jaegertracing/all-in-one:1.57
Open a browser and validate that Jaeger is visible on http://localhost:16686
After a few seconds, refresh the page and you'll see one service listed: jaeger-all-in-one. That is Jaeger tracing itself, so you can ignore that service (but its presence proves everything is working properly).
Building the System: Add an OpenTelemetry Collector
Some backends allow you to send spans directly to them. The Jaeger allInOne image even comes bundled with it's own collector (that's why it's listening on port 4317).
So you may choose to send spans directly to the backend. I do not recommend you do this. I do recommend you place a collector (or several) in front of your backend.
In reality you will have tens, hundreds or thousands of entities producing spans (processes, pods etc.) so placing collectors between those entities and the backend simplifies configuration and provides lots of benefits (I will explain in depth in a future video / post).
Save a file called config.yaml with the following content:
receivers:
  otlp:
    protocols:
      grpc:
        endpoint: 0.0.0.0:6004
      http:
        endpoint: 0.0.0.0:6006

processors:

exporters:
  logging:
    verbosity: detailed

  otlp/localcollector:
    endpoint: http://localhost:4317
    tls:
      insecure: true

service:
  extensions: []
  pipelines:
    traces:
      receivers: [otlp]
      processors: []
      exporters: [otlp/localcollector, logging]
This configuration takes spans into the collector on either port 6004 (when they're sent via gRPC) or port 6006 (when sent via HTTP), does nothing to the spans (nothing in the processors block) and sends them back out again to the http://localhost:4317 endpoint (you will recognise that as the Jaeger gRPC endpoint).
I've also configured some verbose (detailed) logging output. If anything goes wrong during development, I need to quickly see what's wrong. You would probably remove this logging for production.
Why Ports 6004 and 6006?
I've chosen to use ports 6004 and 6006 for two reasons:
- Jaeger is already running on port
4317so I need to choose a different one (hence I randomly picked6004) - The demo app only sends traces via gRPC but to test the configuration (which you'll see next), I also decided to listen on
HTTPand just chose6006.
Download and Start Collector
Download the collector binary for your platform from the latest releases.
Start the collector, passing your config.yaml file as a parameter:
./otelcol --config=config.yaml
The Architecture So Far
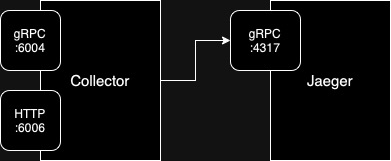
Test It
It is time to ensure the system works and the "wiring" is correct. To do so, we will use a tool called tracepusher. It is a utility which can emit arbitrary spans, it's useful for many "additional" usecases (like tracing CICD pipelines or shell scripts) but we will use it just to send a test span to the collector and see it in Jaeger.
tracepusher only emits spans via HTTP, hence why we needed the collector to listen on port 6006.
Download the tracepusher binary and run it:
./tracepusher \
  --endpoint http://localhost:6006 --insecure true \
  --span-name spanOne \
  --service-name serviceA \
  --duration 2000 \
  --duration-type ms
You should receive: Response <200> from the collector. This proves the span got to the collector.
Check Jaeger
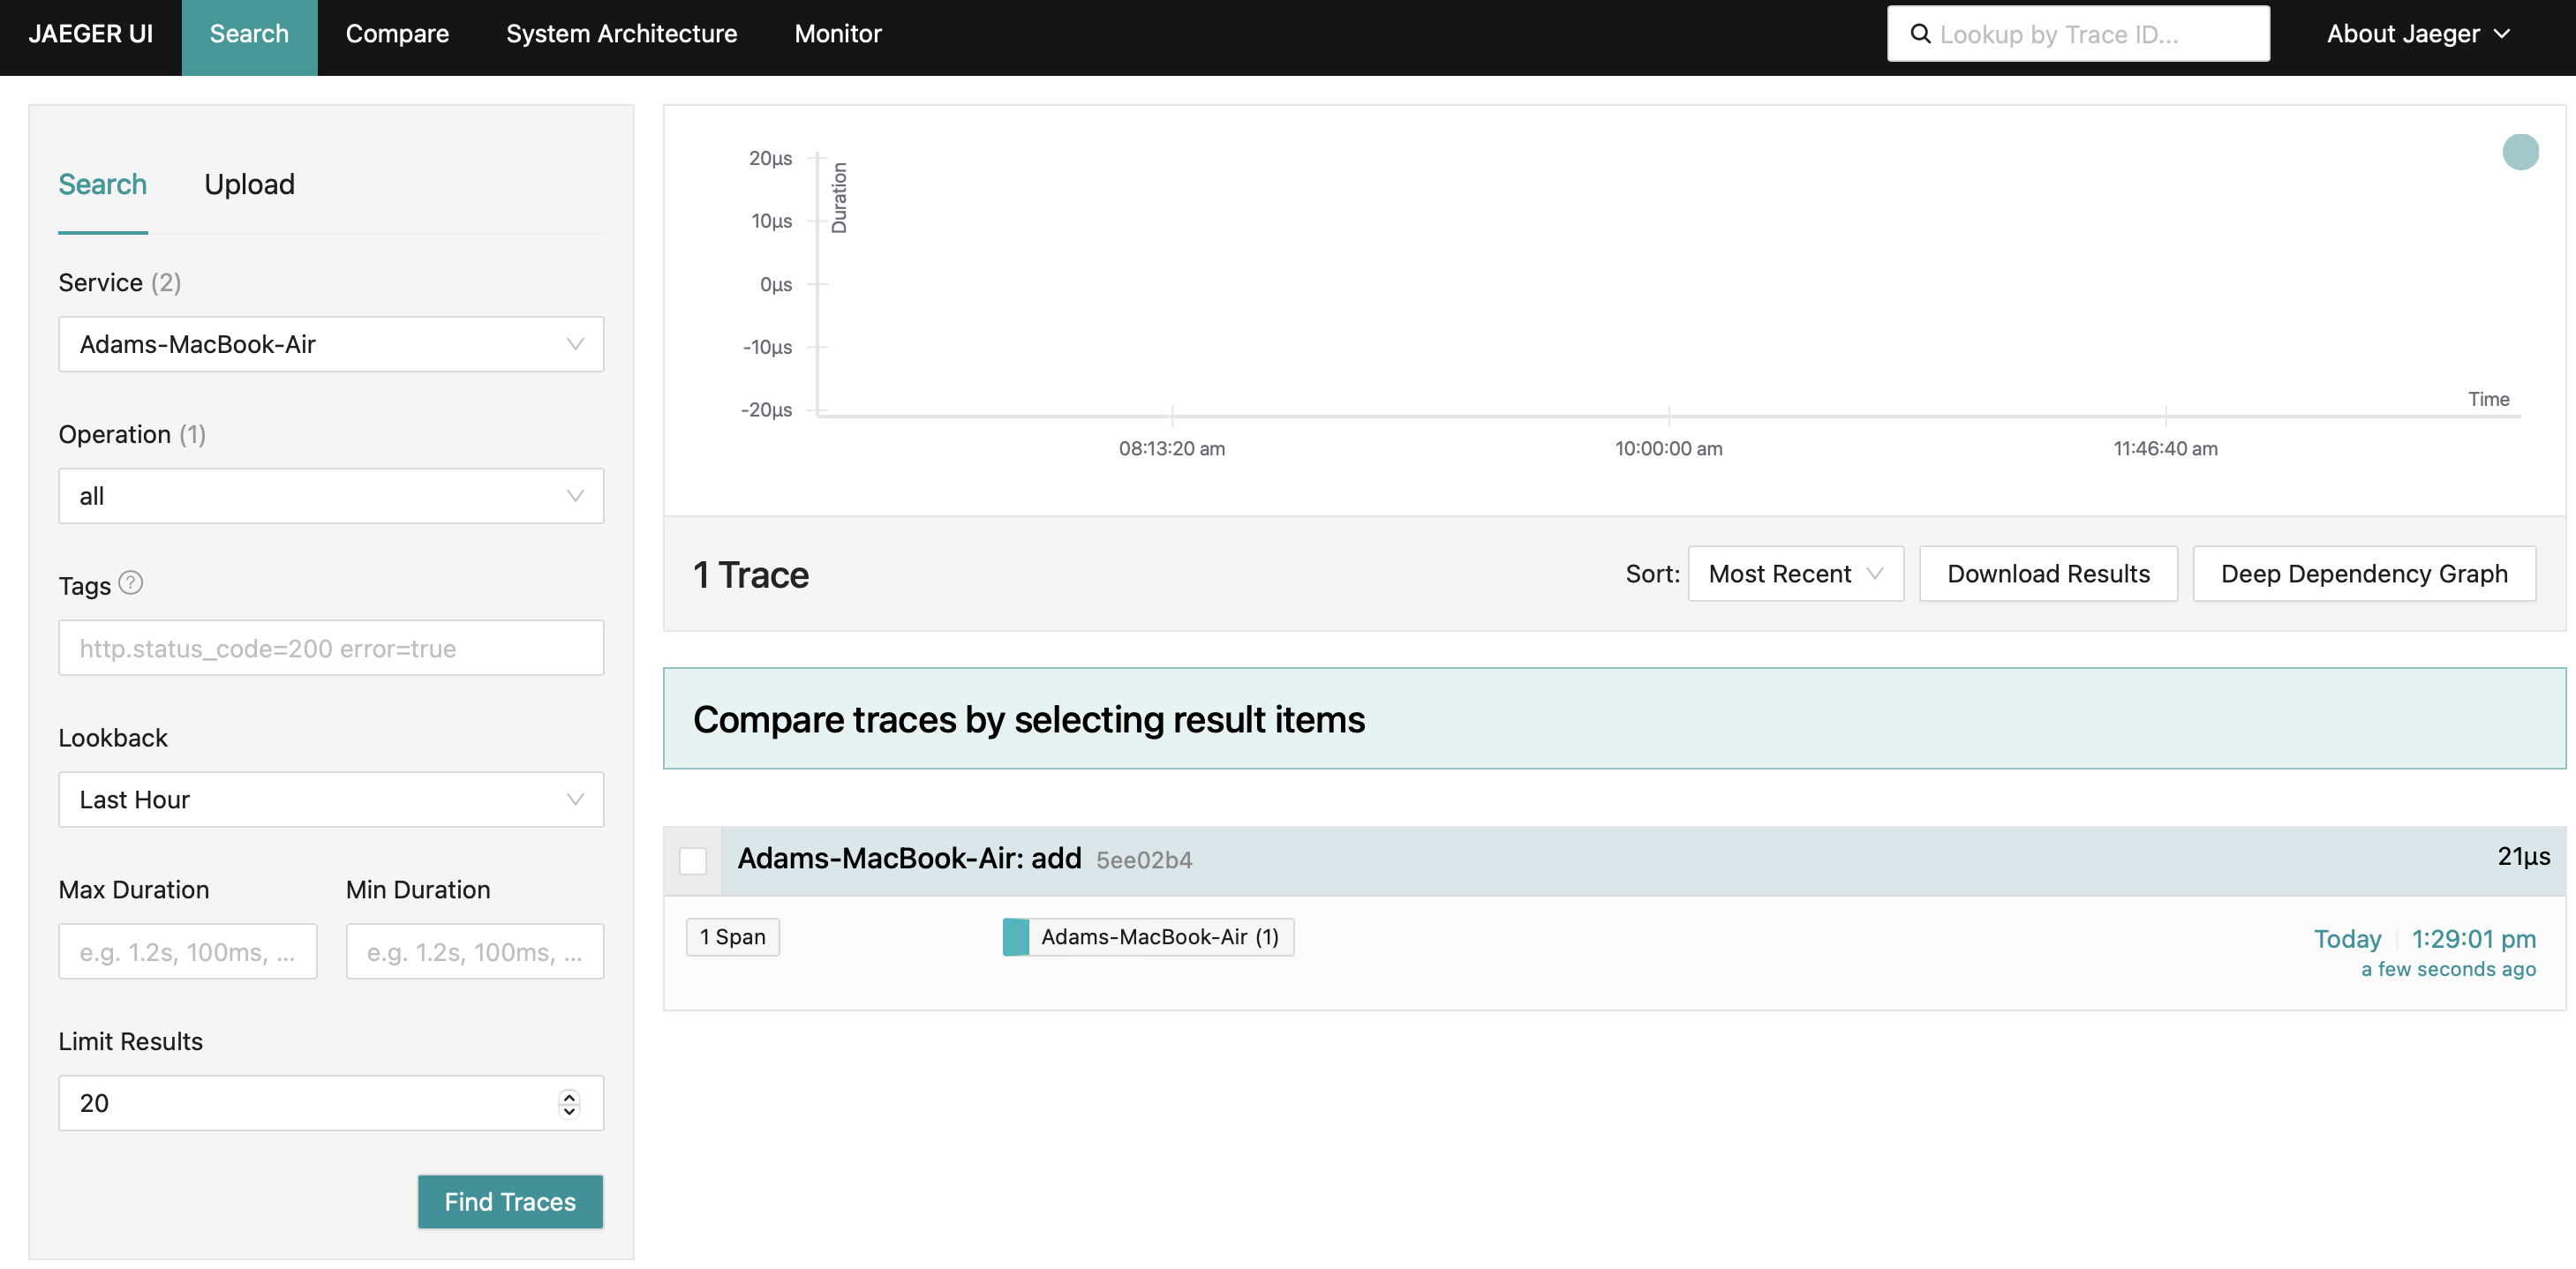
Refresh the Jaeger UI and two services are available. The second one matching the --service-name from tracepusher (ie. serviceA).
Select that service and click Find Traces and you'll see the single span.
The wiring works!
Add Dependencies
Some new dependencies are required, so overwrite requirements.txt with this file:
opentelemetry-api == 1.24.0
opentelemetry-sdk == 1.24.0
opentelemetry-exporter-otlp-proto-grpc == 1.24.0
opentelemetry-semantic-conventions == 0.45b0
Use pip to install these new dependencies:
pip install -r requirements.txt
The App: Export spans to Collector
If you have been following part one and part two of this tutorial, you will already have a file called app.py.
Overwrite the contents of that file with this app.py.
99% of the content is identical but let's run the app and explore the changes.
python app.py
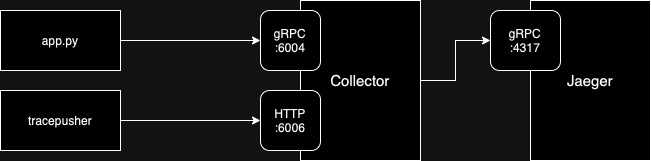
The Architecture So Far
The architecture now looks like this:
Differences in app.py
Line 15 & 16 define two new variables: COLLECTOR_ENDPOINT and COLLECTOR_GRPC_PORT.
Notice that these both point to the standalone collector.
Line 19 replaces the old ConsoleSpanExporter instead with an OTLPSpanExporter which emits spans to http://<COLLECTOR_ENDPOINT>:<COLLECTOR_GRPC_PORT> ie. http://localhost:6004.
Summary
In this post, and the accompanying video, we have successfully sent OpenTelemetry traces from a Python application, via an OpenTelemetry collector, into a span storage backend (Jaeger).
In the next installment of this series, we will re-write the application to emit a trace which contains multiple spans. So, subscribe to my channel on Youtube and I'll see you then!