Tracing Python, FastAPI and requests through Apache Camel 4 using OpenTelemetry
In this post I'm going to walk you through how to trace from Python through Apache Camel to another Python process. End to end using OpenTelemetry - and it's really not as hard as it sounds!
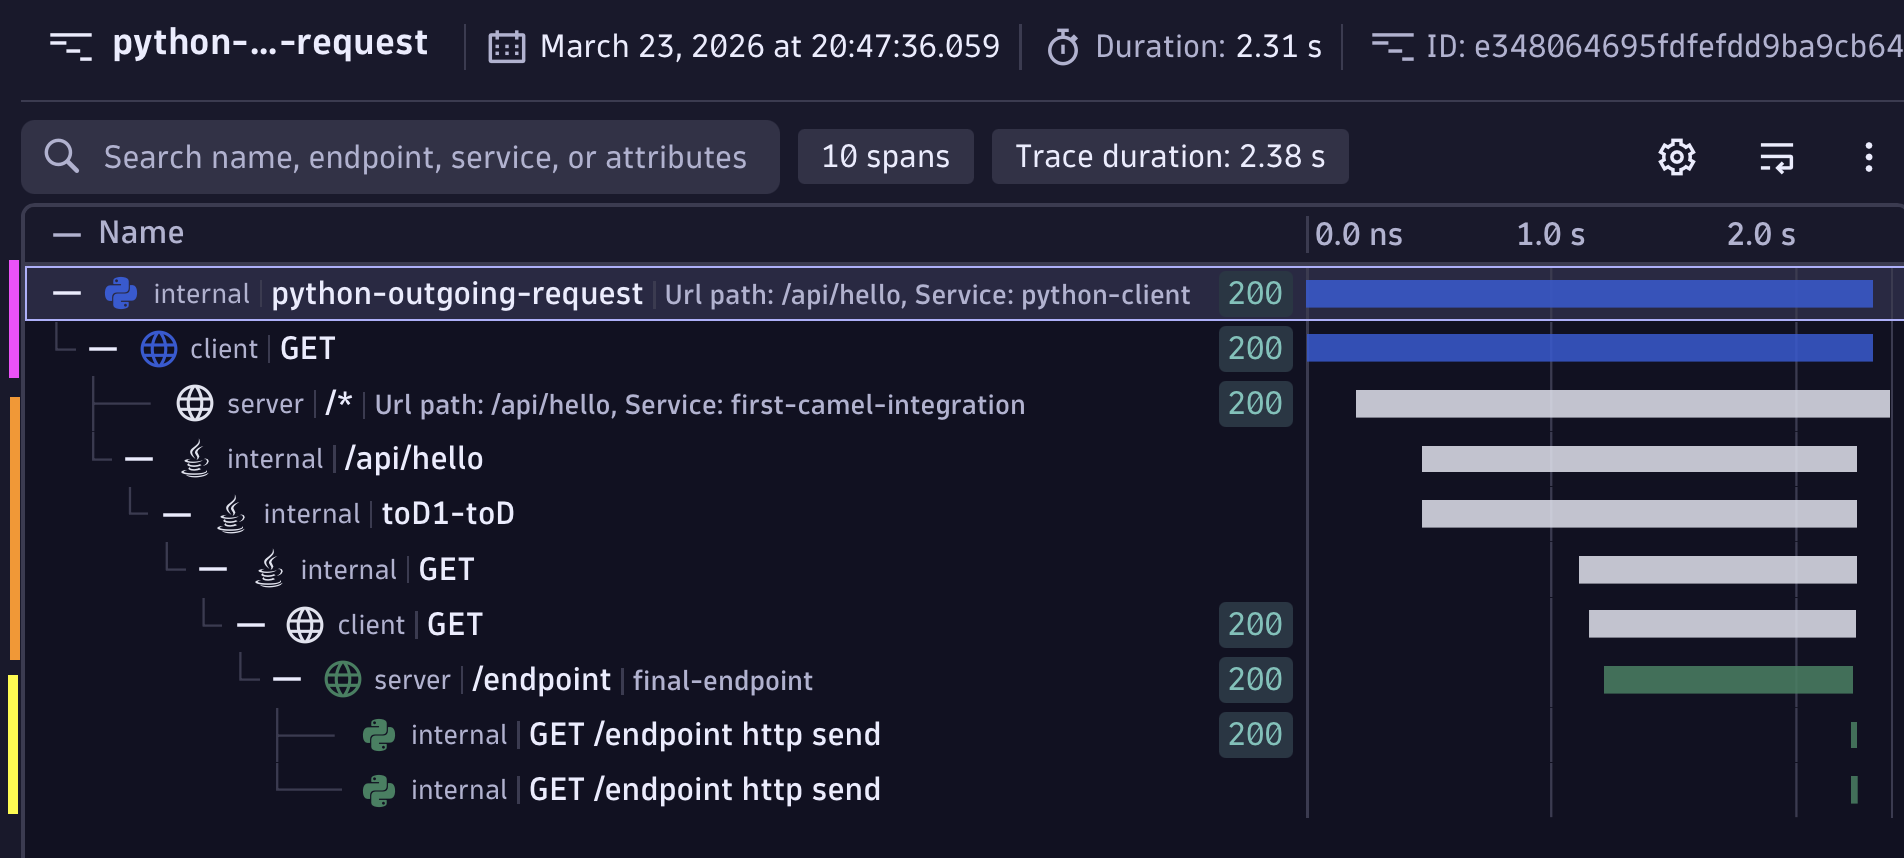
Python --> Apache Camel --> Python