In this post & video I'll demonstrate how to get full end-to-end Observability of your multi-agent CrewAI crews using Traceloop OpenLLMetry and the OpenTelemetry collector.
Watch
If you'd prefer to watch rather than read, I have the following content as a YouTube video:
CrewAI bills itself as a multi agent framework and orchestration tool.
There are two main concepts:
- Crews: Loosely think of this as a "team" of agents. Each agent has a "role" or "job" and they work together - much like a human team would, to achieve a goal. The key here is that when each agent in the crew does something is entirely driven by the crew itself. In other words, they handoff between each other.
- Flows: These are workflows that you design. Being prescriptive workflows, they're much more "designed" and therefore deterministic. They are event-driven so again, you control everything about flows.
It's worth saying that the two concepts can interact and work together: Crews can call workflows at defined points and / or flows can trigger crews. So - the marketing text says - you can get the best of both worlds.
In either case, Observability of both crews and flows is critical. If you allow a crew to do whatever (and whenever) it likes, without knowing what's happening within the crew, you're really asking for trouble. Likewise, if a (work)flow that you've triggered fails, you need to know which step failed and the reason so that you can fix it.
Enter OpenLLMetry and the OpenTelemetry collector.
OpenLLMetry is a framework that "wraps" calls that go to LLMs and this enables us to deeply observe and monitor what and how the LLMs are interacting with one another, when handoffs occur, what data is being passed back and forth - basically everything happening within the crew. OpenLLMetry is based on OpenTelemetry and this also provides the means to instrument your workflows (aka flows).
Install CrewAI and Create a Crew
Start by installing CrewAI following their guide.
Now create a CrewAI crew. This is the scaffolding that defines your crew. I'll follow their quickstart guide to create a first crew:
crewai create crew my_first_crew
Add OpenLLMetry
Next add traceloop as a dependency in your project. This will trace the goings-on of the LLMs in the crew.
- Open this file:
my_first_crew/pyproject.toml. - In the dependencies section, add a new dependency on
"traceloop-sdk"
It should look something like this:
...
"dependencies" = [
  "crewai[tools]==1.1.0",
  "traceloop-sdk"
]
...
- Open
src/main.py - Add the following two lines to the file:
from traceloop.sdk import Traceloop
Traceloop.init(api_endpoint="http://localhost:4318", app_name="crewAI")
Finally, install the crewai packages:
pip install traceloop-sdk
Collector
The localhost:4318 address above should point to an OpenTelemetry Collector. We haven't spun that up yet, but we will in the following step.
Configure and Start Collector
The OpenTelemetry Collector is the component that the application will send telemetry data to. The collector has lots of uses (I have lots more content on the collector on this blog & my YouTube channel) and is such a useful component, I consider it a mandatory piece of a modern Observability setup. In short, think of it as an ETL pipeline - you can transform, batch, redact, filter and drop data - plus you can transform one signal type to another (eg. take in logs and transform them to metrics).
OpenTelemetry Collector
The OpenTelemetry collector is a mandatory part of a modern Observability platform.
First you'll need to download the collector binary (or run it as a docker container - take your pick). You can download it from here.
The collector requires a configuration file on startup. Save this as a YAML file called collector-config.yaml:
receivers:
  otlp:
    protocols:
      http:
        endpoint: localhost:4318

exporters:
  debug:
    verbosity: detailed

service:
  pipelines:
    metrics:
      receivers: [otlp]
      processors: []
      exporters: [debug]
    traces:
      receivers: [otlp]
      processors: []
      exporters: [debug]
    logs:
      receivers: [otlp]
      processors: []
      exporters: [debug]
If this is the first time you've seen a collector config, the above may look daunting, but here's what it does:
- The top sections define the configuration of the potential components and their configuration
- The bottom section defines how those components are "wired" together (think about the flow of data coming into the collector, how it is processed and how data will leave the collector)
- Data will be received into the collector via the OTLP protocol (traceloop will send this)
- Metrics, traces and logs will all be sent out of the collector to the
debugexporter (which means the data will be dumped to the collectors stdout)
If you have a "proper" Observability backend you can also add additional exporters - just follow the instructions given by your Observability vendor / tool.
Start Collector
Start the collector (assuming you've downloaded and extracted the contrib collector binary):
./otelcol-contrib --config=collector-config.yaml
Start Application
The collector is now running and ready to accept telemetry. It is time to start the crew:
cd my_first_crew
crewai run
Collector Output
Recall that a "crew" is a set of agents. Look at my_first_crew/src/my_first_crew/config/agents.yaml to understand which agents you have in your crew (ie. on your team). There are two: A reporting analyst and a senior data researcher. Both are specified to be experts in a certain {topic}. They will work together to produce a final report on the given topic (provided as a variable).
The {topic} variable is defined in my_first_crew/src/my_first_crew/main.py in the inputs variable defined in the run function:
inputs = {
        'topic': 'AI LLMs',
        'current_year': str(datetime.now().year)
    }
Think about it, the agents will each "do something" then potentially hand off to the other agent. The second agent will "do something" then potentially hand back to the first - and so on - until they determine the task is complete. Each of these "doing something" tasks will be represented in OpenTelemetry as a single unit of work (a span). All spans will share a common ID which "ties" all of this work together (think about all of the work being done against a single JIRA ticket ID).
So, back to the collector output. You should see output in the collector like this:
Span #0
    Trace ID       : e838675910b9a2a2ba5b0506220fe163
    Parent ID      : 0ab44914113b77a6
    ID             : faa3fa3de19d1f1c
    Name           : AI LLMs Reporting Analyst
.agent
    Kind           : Client
    Start time     : 2025-10-23 22:42:55.271987 +0000 UTC
    End time       : 2025-10-23 22:43:17.058684 +0000 UTC
    Status code    : Ok
    Status message :
Attributes:
     -> traceloop.span.kind: Str(agent)
     -> crewai.agent.id: Str(1ff74c04-0910-4872-ad6d-0022f18b8d20)
     -> crewai.agent.role: Str(AI LLMs Reporting Analyst
)
     -> crewai.agent.goal: Str(Create detailed reports based on AI LLMs data analysis and research findings
)
     -> crewai.agent.backstory: Str(You're a meticulous analyst with a keen eye for detail. You're known for your ability to turn complex data into clear and concise reports, making it easy for others to understand and act on the information you provide.)
     -> crewai.agent.cache: Str(True)
     -> crewai.agent.verbose: Str(True)
     -> crewai.agent.allow_delegation: Str(False)
     -> crewai.agent.tools: Str([])
     -> crewai.agent.max_iter: Str(25)
     -> crewai.agent.agent_executor: Str(<crewai.agents.crew_agent_executor.CrewAgentExecutor object at 0x112669810>)
     -> crewai.agent.llm: Str(<crewai.llms.providers.openai.completion.OpenAICompletion object at 0x112651d10>)
     -> crewai.agent.crew: Str(parent_flow=None name='crew' cache=True tasks=[Task(description=Conduct a thorough research about AI LLMs Make sure you find any interesting and relevant information given the current year is 2025.
, expected_output=A list with 10 bullet points of the most relevant information about AI LLMs
), Task(description=Review the context you got and expand each topic into a full section for a report. Make sure the report is detailed and contains any and all relevant information.
, expected_output=A fully fledged report with the main topics, each with a full section of information. Formatted as markdown without '```'
)] agents=[Agent(role=AI LLMs Senior Data Researcher
, goal=Uncover cutting-edge developments in AI LLMs
, backstory=You're a seasoned researcher with a knack for uncovering the latest developments in AI LLMs. Known for your ability to find the most relevant information and present it in a clear and concise manner.
), Agent(role=AI LLMs Reporting Analyst
, goal=Create detailed reports based on AI LLMs data analysis and research findings
, backstory=You're a meticulous analyst with a keen eye for detail. You're known for your ability to turn complex data into clear and concise reports, making it easy for others to understand and act on the information you provide.)] process=<Process.sequential: 'sequential'> verbose=True memory=False short_term_memory=None long_term_memory=None entity_memory=None external_memory=None embedder=None usage_metrics=None manager_llm=None manager_agent=None function_calling_llm=None config=None id=UUID('b52329b4-2247-421b-b868-3274d932741a') share_crew=False step_callback=None task_callback=None before_kickoff_callbacks=[] after_kickoff_callbacks=[<function crew.<locals>.wrapper.<locals>.callback_wrapper.<locals>.bound_callback at 0x102cd87c0>] max_rpm=None prompt_file=None output_log_file=None planning=False planning_llm=None task_execution_output_json_files=None execution_logs=[] knowledge_sources=None chat_llm=None knowledge=None security_config=SecurityConfig(fingerprint=Fingerprint(metadata={})) token_usage=None tracing=False)
     -> crewai.agent.i18n: Str(prompt_file=None)
     -> crewai.agent.tools_handler: Str(<crewai.agents.tools_handler.ToolsHandler object at 0x1125c2310>)
     -> crewai.agent.tools_results: Str([])
     -> crewai.agent.security_config: Str(fingerprint=Fingerprint(metadata={}))
     -> crewai.agent.callbacks: Str([])
     -> crewai.agent.adapted_agent: Str(False)
     -> crewai.agent.use_system_prompt: Str(True)
     -> crewai.agent.allow_code_execution: Str(False)
     -> crewai.agent.respect_context_window: Str(True)
     -> crewai.agent.max_retry_limit: Str(2)
     -> crewai.agent.multimodal: Str(False)
     -> crewai.agent.inject_date: Str(False)
     -> crewai.agent.date_format: Str(%Y-%m-%d)
     -> crewai.agent.code_execution_mode: Str(safe)
     -> crewai.agent.reasoning: Str(False)
     -> crewai.agent.guardrail_max_retries: Str(3)
     -> gen_ai.request.model: Str(gpt-4)
     -> gen_ai.response.model: Str(gpt-4)
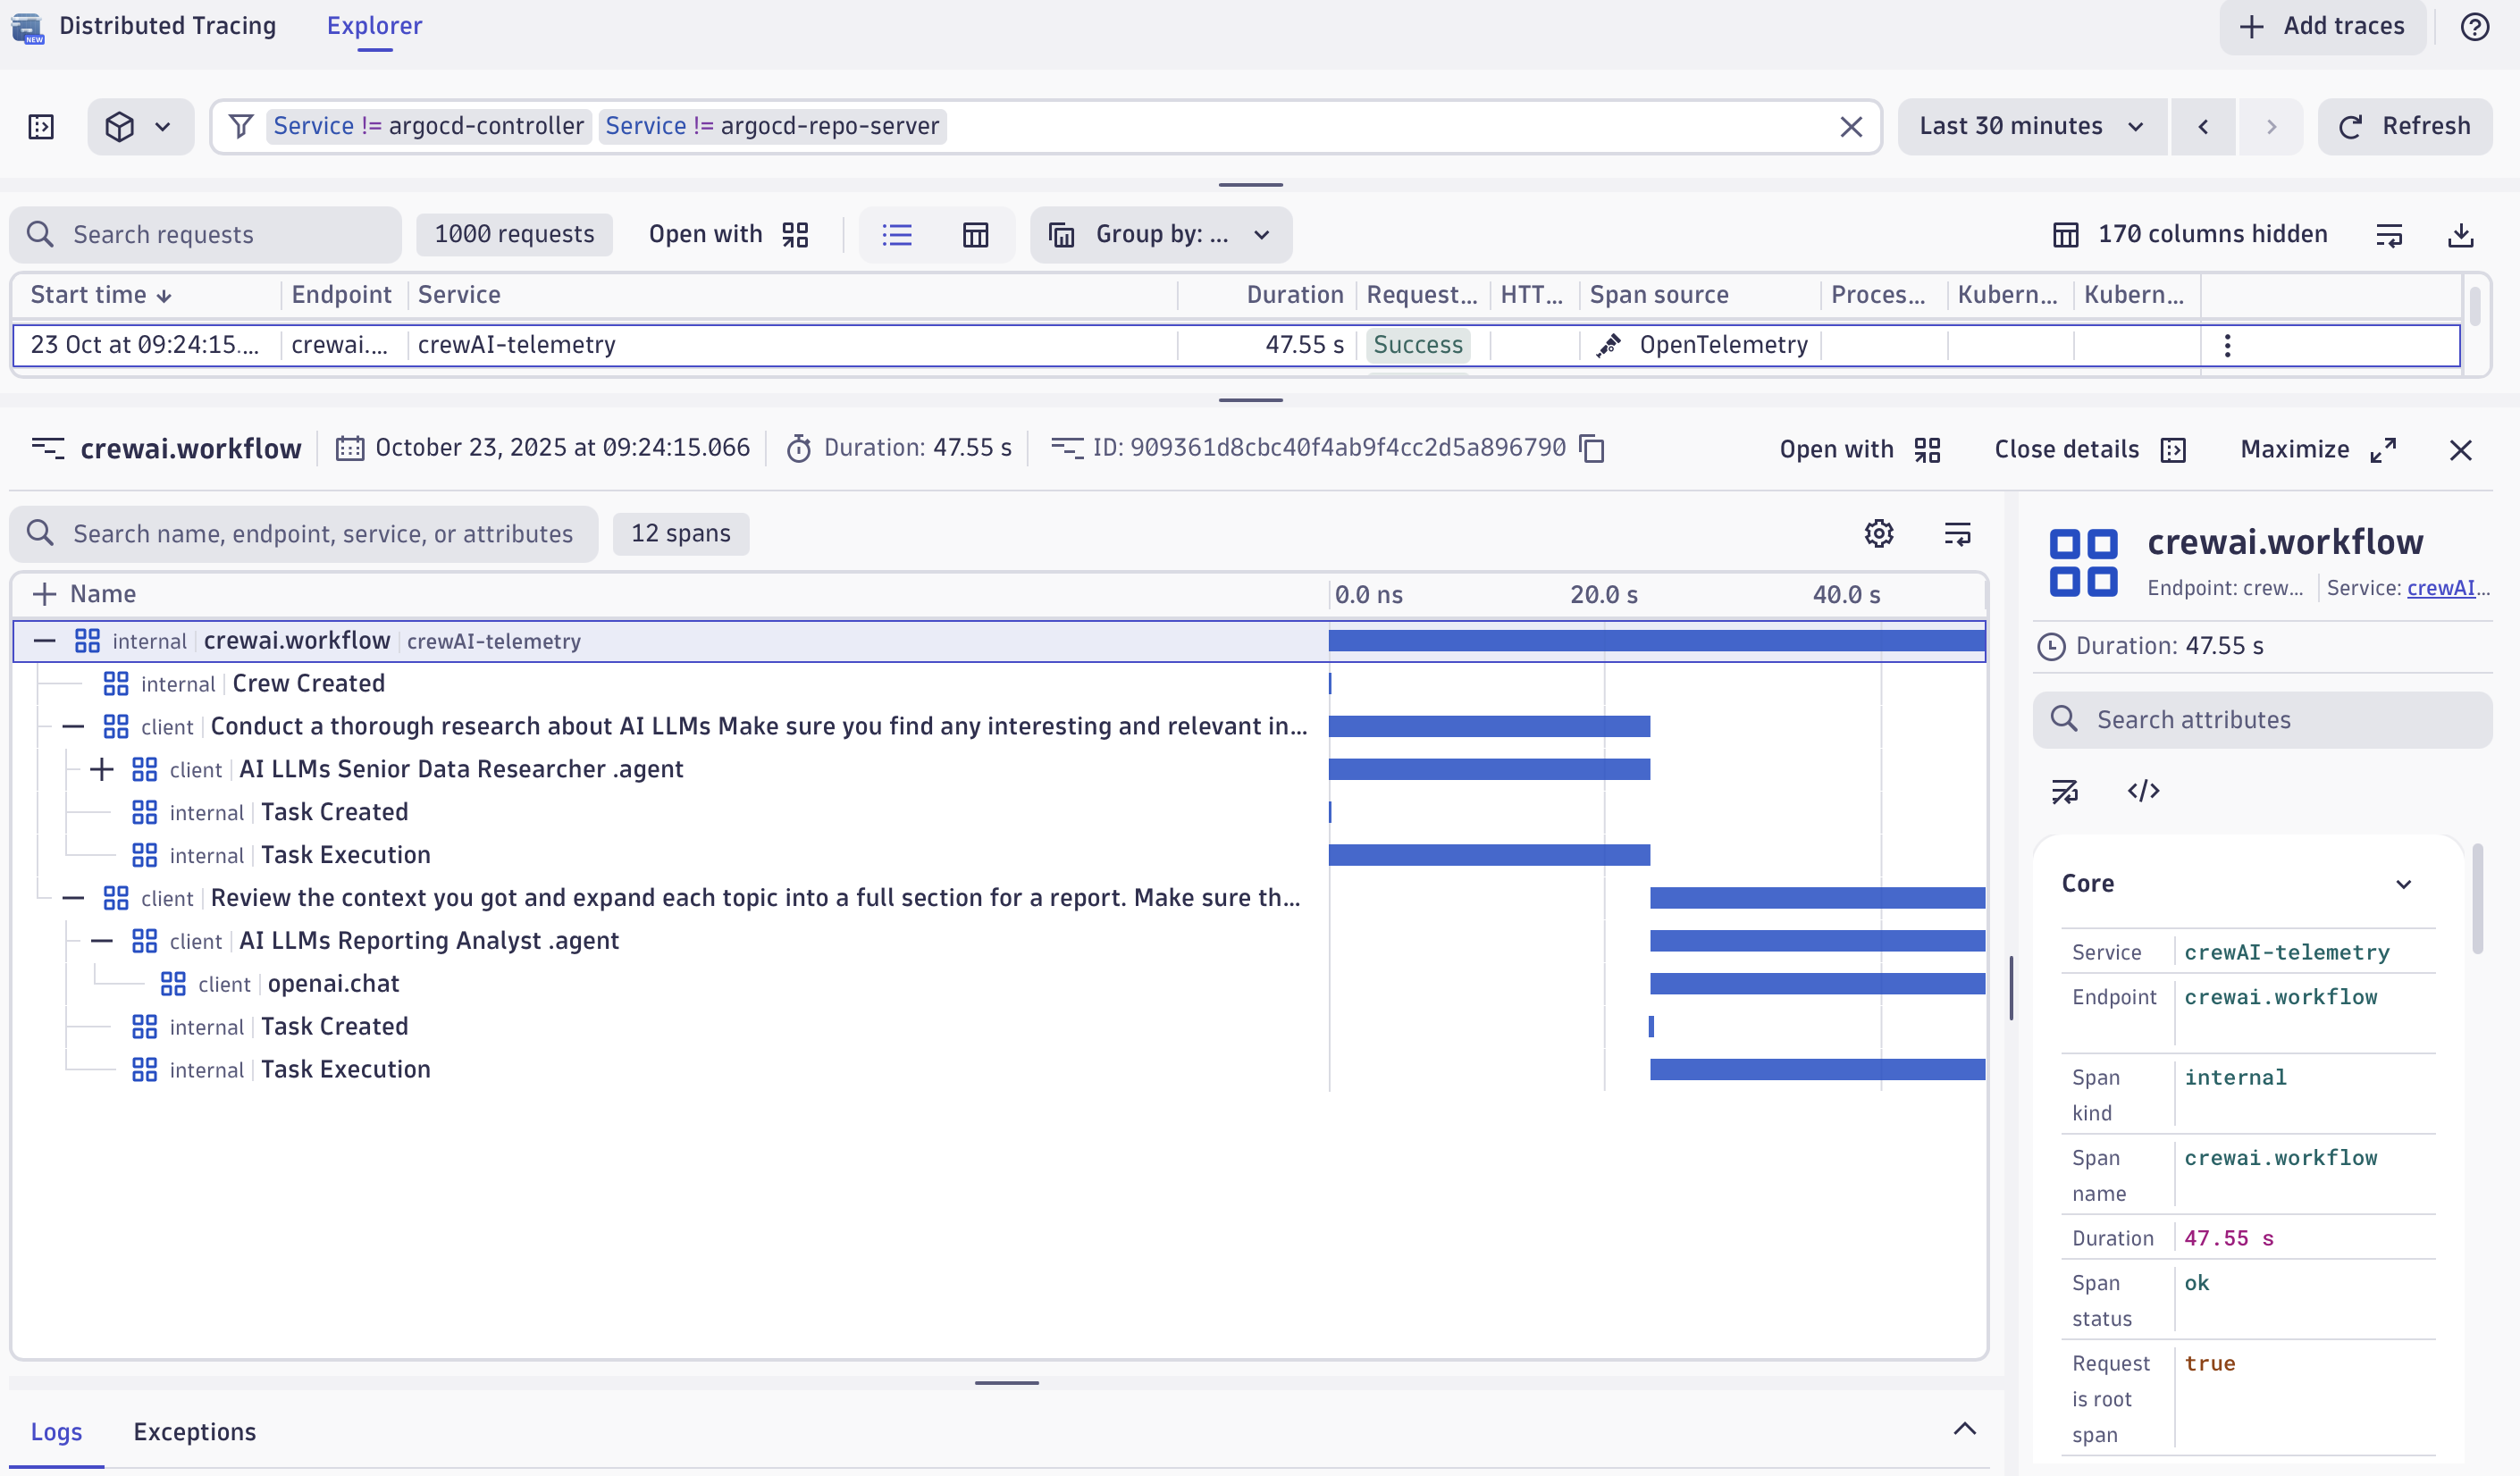
This is the textual representation of a single span. It is a single "task" being done and, as you can see, you have all of the information about this task. The inputs, parameters, attributes and outputs.
This span represents one of the blue bars in the diagram below.
Look more closely at the collector output. Notice that all spans share the same trace ID. This is how the Observability system understands that all of these spans are part of the same "unit of work" and thus visualise them together as you see above.
Span #0
    Trace ID       : e838675910b9a2a2ba5b0506220fe163
Span #1
    Trace ID       : e838675910b9a2a2ba5b0506220fe163
...
Metrics
OpenLLMetry also emits metrics and you can see these in teh collector logs too. In this case, a histogram of token usage.
ScopeMetrics #1
ScopeMetrics SchemaURL:
InstrumentationScope opentelemetry.instrumentation.crewai.instrumentation 0.36.0
Metric #0
Descriptor:
     -> Name: gen_ai.client.token.usage
     -> Description: Measures number of input and output tokens used
     -> Unit: token
     -> DataType: Histogram
     -> AggregationTemporality: Cumulative
HistogramDataPoints #0
Data point attributes:
     -> gen_ai.system: Str(crewai)
     -> gen_ai.token.type: Str(input)
     -> gen_ai.response.model: Str(gpt-4)
StartTimestamp: 2025-10-23 22:42:55.267706 +0000 UTC
Timestamp: 2025-10-23 22:43:17.074056 +0000 UTC
Count: 2
Sum: 0.000000
Min: 0.000000
Max: 0.000000
ExplicitBounds #0: 1.000000
ExplicitBounds #1: 4.000000
ExplicitBounds #2: 16.000000
ExplicitBounds #3: 64.000000
ExplicitBounds #4: 256.000000
ExplicitBounds #5: 1024.000000
ExplicitBounds #6: 4096.000000
ExplicitBounds #7: 16384.000000
ExplicitBounds #8: 65536.000000
ExplicitBounds #9: 262144.000000
ExplicitBounds #10: 1048576.000000
ExplicitBounds #11: 4194304.000000
ExplicitBounds #12: 16777216.000000
ExplicitBounds #13: 67108864.000000
Buckets #0, Count: 2
Buckets #1, Count: 0
Buckets #2, Count: 0
Buckets #3, Count: 0
Buckets #4, Count: 0
Buckets #5, Count: 0
Buckets #6, Count: 0
Buckets #7, Count: 0
Buckets #8, Count: 0
Buckets #9, Count: 0
Buckets #10, Count: 0
Buckets #11, Count: 0
Buckets #12, Count: 0
Buckets #13, Count: 0
Buckets #14, Count: 0
Exemplars:
Exemplar #0
     -> Trace ID: e838675910b9a2a2ba5b0506220fe163
     -> Span ID: faa3fa3de19d1f1c
     -> Timestamp: 2025-10-23 22:43:17.058611 +0000 UTC
     -> Value: 0
Limits of OpenLLMetry
OpenLLMetry only instruments the calls to/from AI providers.
You will still need either auto-instrumentation, manual instrumentation or a vendor's agent to fully instrument the remainder of your application logic (eg. calls to / from APIs or other systems).
Summary
CrewAI is a relatively easy way to build teams of agents that collaborate towards a common goal.
Adding OpenLLMetry provides the essential visibility into how, why and when they're doing work. Plus, it enables you to track the all important key metrics like token usage - so you don't get a shock on your AI bill!