Hands On With Pitometer
Build an automated quality gate in under 5 minutes with this hands on demo of Pitometer...
Prerequisites
- A Dynatrace SaaS Tenant (free trial here).
- An Amazon EC2 instance (free tier is fine).
- Ansible installed on a control machine.
- Python
netaddrinstalled on ansible control machine (pip install netaddr)
Need some background info? Need to know why you should use Pitometer?
Read this overview post first.
Scenario
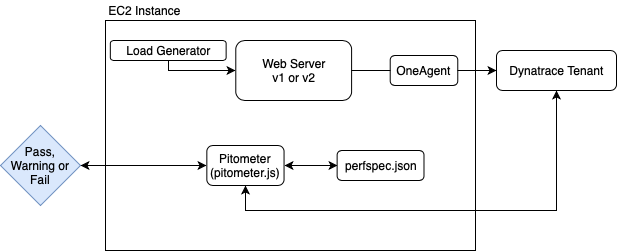
We’ll build a system which runs one of two versions of a web server. This web server will be placed under artificial load by a load generator installed on the EC2 instance. The EC2 instance will be monitored with the Dynatrace OneAgent.
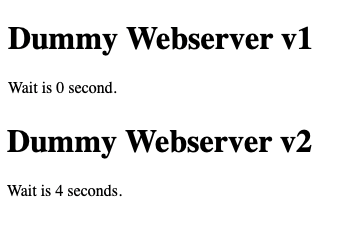
- Web server version 1 has a wait time of zero seconds.
- Web server version 2 has a wait time of 4 seconds.
- Pitometer is installed onto the same EC2 instance and is configured to have a
warning thresholdof3 secondsand asevere thresholdof5 seconds.
When Pitometer is run, it will read a perfspec file. This perfspec file contains our quality criteria and thresholds.
Pitometer will retrieve response time statistics from Dynatrace and evaluate against the criteria from the perfspec file.
Pitometer will provide a pass, warning or fail decision based on the execution.
Your pipeline technology can then utilise this decision to stop or progress the build.
Expected Output
We’re expecting a pass decision for version 1 since it is under the 3 second response time threshold (see above).
We’re expecting a warning decision for version 2 since response time is over 3 seconds but under 5 seconds (see above).
Installation
- Add your EC2 instance to the
pitometergroup of your/etc/ansible/hostsfile. - Ensure you can ping your node with:
ansible -m ping pitometer - If you want to access the web server UI, ensure port 80 is open to your IP address.
- Save this Ansible playbook to your control node.
- Modify the
varssection of the playbook to reflect your values. - Install the system with:
{% raw %}
{% endraw %}
ansible-playbook ~/pitometerDemo.playbook.yml --tags install
Unsupported parameters for (yum) module warning? Either upgrade your ansible to >2.8 or comment out the
lock_timeoutline of theInstall Docker and Git Packagestask.
Recap
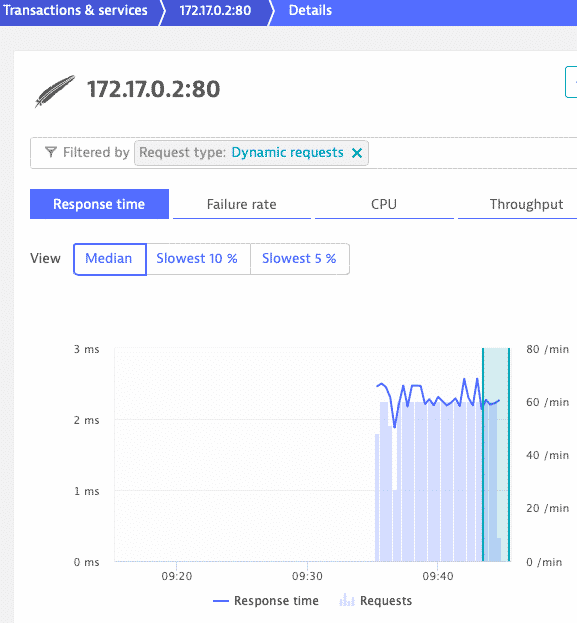
The Ansible playbook has installed the system for us. It has spun up version 1 of the web server and started the load generator. You should now see statistics in Dynatrace:
Execute Pitometer
Now that you have some statistics in Dynatrace, let’s run Pitometer and see the output.
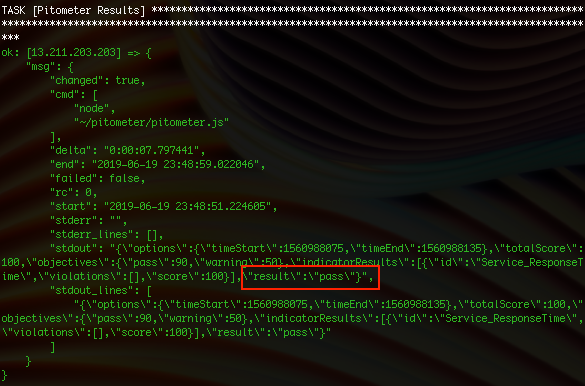
Remember that we’re running version 1 so we’re expecting a "result": "pass" output.
{% raw %}
ansible-playbook ~/pitometerDemo.playbook.yml --tags runPitometer
Switch To Version 2
Now let’s switch to version 2 of the web server. Remember that this version includes a 4 second wait.
{% raw %}
ansible-playbook ~/pitometerDemo.playbook.yml --tags runWaiterV2
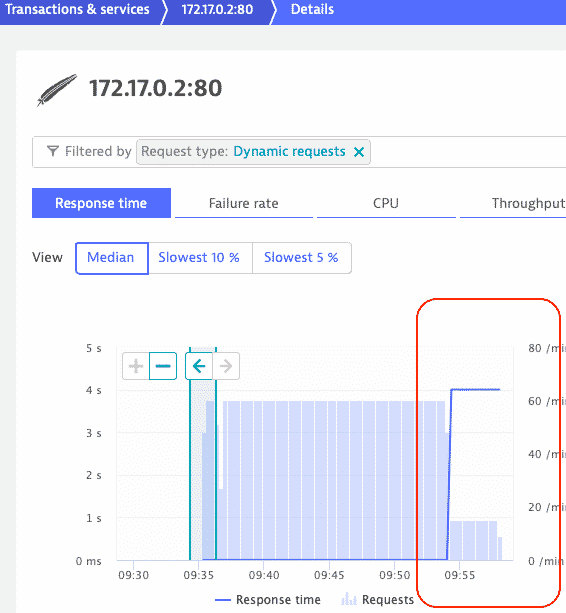
Wait a minute or so until the new longer response time statistics are reflected in Dynatrace. Notice the increased response time and the drop in throughput.
Re-Run Pitometer
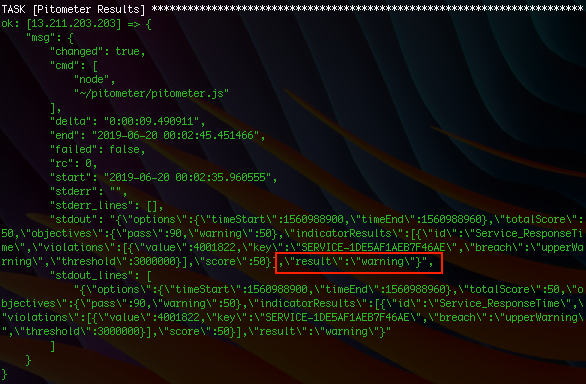
This time, we expect Pitometer to produce a "result": "warning" output. Our response time is 4 seconds and our warning threshold is set at 3 seconds:
{% raw %}
ansible-playbook ~/pitometerDemo.playbook.yml --tags runPitometer
Toggle Between v1 & v2
If you’d like to toggle between v1 and v2 of the web server, just run the following commands:
{% raw %}
ansible-playbook ~/pitometerDemo.playbook.yml --tags runWaiterV1
ansible-playbook ~/pitometerDemo.playbook.yml --tags runWaiterV2
Summary
This tutorial demonstrated how to create a simple automatic quality gate using the open source Pitometer tool & provides a repeatable demo system you can use.