Dynatrace Basics: Creating Measures
Legacy Product
This tutorial refers to the legacy application monitoring product from Dynatrace. Not the Dynatrace platform.
This tutorial will how to setup long term trending of your applications and key transactions in Dynatrace AppMon. It will use a concept called measures.
What is a Measure?
Put simply, it’s a piece of your application that you wish to measure. Dynatrace will automatically create Purepaths for every transaction (Dynatrace does not sample data) but for long term trending, you’ll want to explicitly set up a measure on the transaction. Once done, the data will be stored forever in the Dynatrace database (performance warehouse).
Measures are the way to track long term trends in metrics.
The Business Requirement
Imagine that the business has given us 3 requirements:
- Track the response time of the batch job.
- Track the response time of the batch job when the batch type is Type B.
- Track the response time of the batch job per execution type (ie. response time of Type A vs. Type B).
Demo Code
Here’s the demo JAR file we’ll be using in this tutorial (and here’s the source code on Github if you want it).
The JAR file randomly calculates a boolean and if it’s true, the batch is said to be “Type A”. If false, the batch is “Type B”. If the batch is “Type B”, the process pauses for an extra 3 seconds (the reason for this will become clear later).
/* Randomly pick A or B
* Arbitrarily, if true it’s “Type A” if false it’s “Type B”
* Note: We use Strings to make it clearer to the reader.
* Dynatrace AppMon works perfectly well with booleans or numbers or anything else.
*/
String strBatchType = "";
Random oRandom = new Random();
boolean bSwitch = oRandom.nextBoolean();

if (bSwitch) strBatchType = "Type A";
else strBatchType = "Type B";

startBatch(strBatchType);
Thread.sleep(2000);

// Fake an issue when Batch Type is “Type B”, pause for 3s.
private static void doThis(String strBatchType)
{
  System.out.println("Now doing this...");
  if (strBatchType.equals("Type B"))

try
{
  Thread.sleep(3000);
}
catch (Exception e){}

System.out.println("---");
}
First, let’s run the JAR without Dynatrace to prove it works: java -jar DTBasicsCreatingMeasures.jar
Now instrument it with the -agentpath parameter you received when you setup your agent tier.
No idea what I’m talking about? Read this tutorial to understand how to instrument your JAR.
Sensor Configuration
You should now have your agent connected (view the Agent Overview dashlet to verify) but you won’t be getting any Purepaths yet. Let’s correct that now.
-
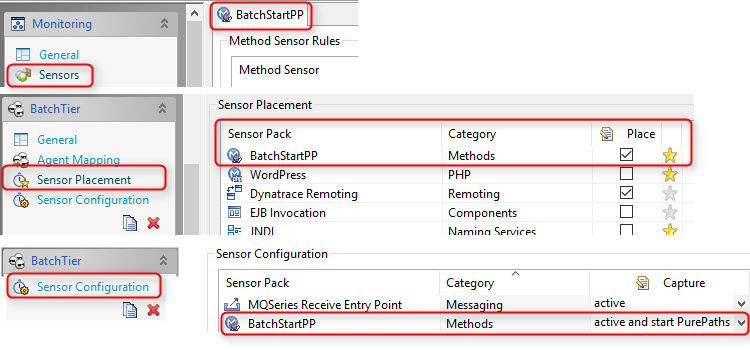
Open the system profile > sensors and create a new sensor group. Called BatchStartPurepath (the name is arbitrary but it’ll help you understand what’s going on later).
-
Make sure your sensor group is deployed to the relevant agent group. Next, in the sensor configuration, make sure you’ve set the sensor pack to Active and Start Purepaths.
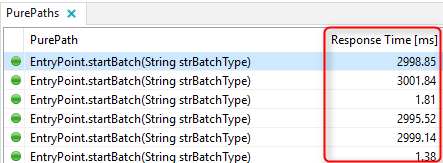
- Restart the JAR file and open the Purepaths dashlet. You should now see purepaths of varying lengths.
Satisfy Business Requirement #1
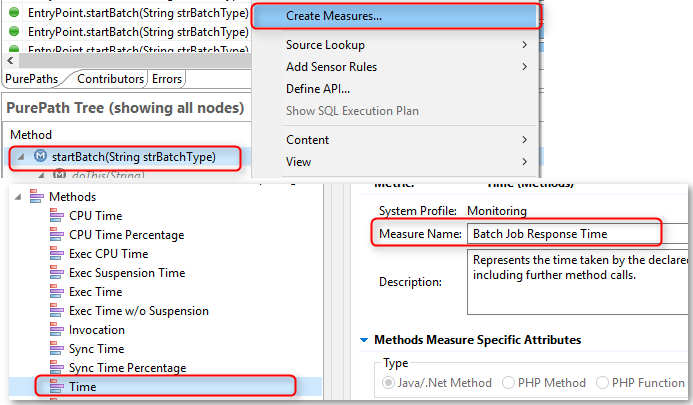
To track the overall response time, simply create a measure on the purepath as a whole.
- Right click the first purepath node (in the Purepath Tree view). Select Create Measure.
- Choose the Time measure and give it a good name.
- Click OK.
Your batch job is now being monitored and the data is being saved into the Performance Warehouse Database for long term trending.
Viewing the Results - Charting
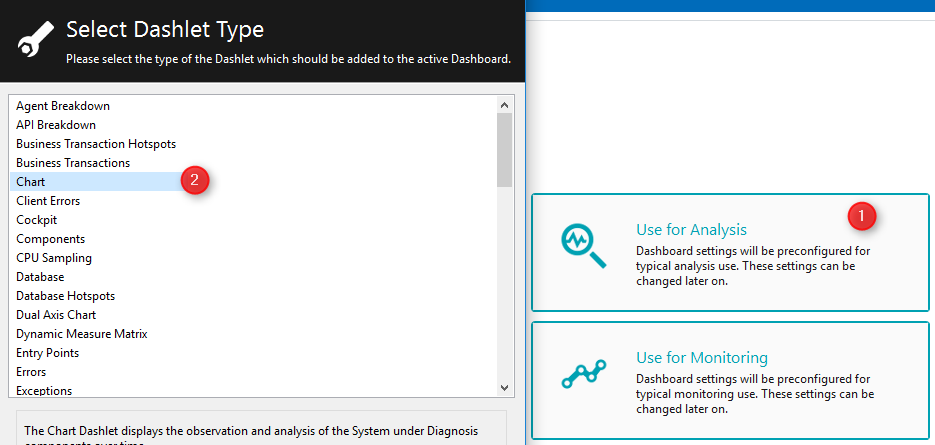
- Press Ctrl + N to create a new dashboard. Select Use for Analysis.
- Add a Chart dashlet.
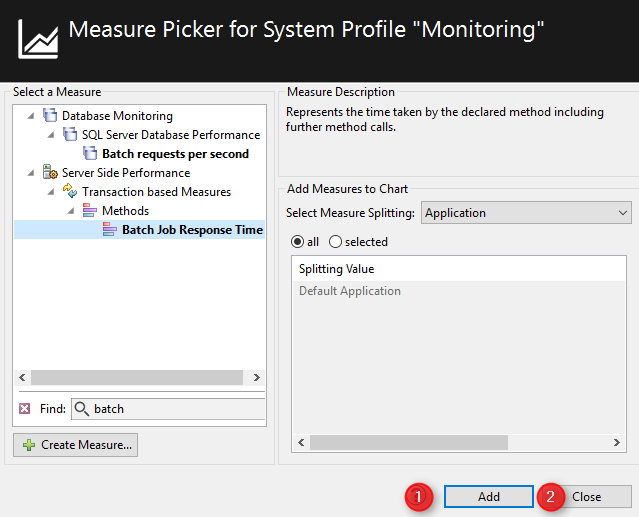
- In the measure dashlet, search for (hint:
Ctrl + F) the Batch Job Response Time measure. - Chart it.
- Hit the refresh icon a few times (the circular arrow highlighted below) and you’ll see data start to flow into the system.
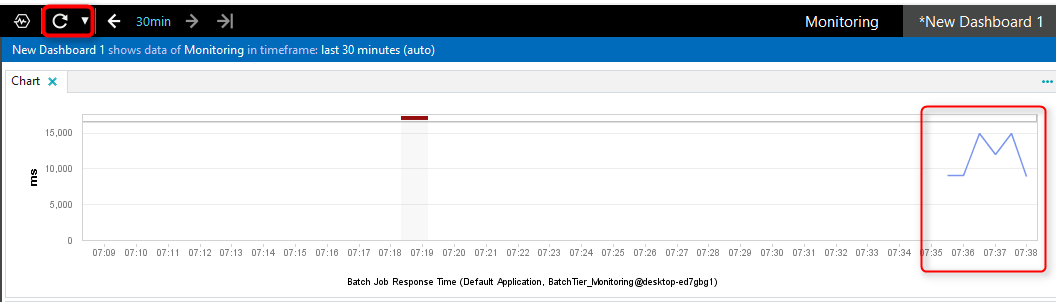
For business requirements #2 and #3 we’ll need to introduce a new concept called Business Transactions. Stay tuned for the Business Transactions tutorial.